Advanced monitoring tools – The Tools to Take Your DevOps to the Next Level
Advanced monitoring tools
The purpose behind monitoring has always been to make sure that the things you said were working are still working. And it is often the case that they won’t be. It could be your fault or not; the concept of fault gets in the way of solving the problem. The proper monitoring of your workloads provides the path to more easily solving your problems.
The simplest workloads can be monitored and the reactions to the information received can be automated so that you don’t even have to be involved most of the time when it comes to dealing with something going wrong. In more complex workloads, it is still important to keep up monitoring for faster reaction times to any situation, as well as to get more information on the situation in real time.
Often, your solution, as it gets more complex, starts using more tools. More tools and services means the requirement for more monitoring and also more complex monitoring. If your monitoring comes from multiple places at the same time, it can become quite a hassle to deal with. So, a good solution in this case would be to centralize the monitoring in a central location that can hold and manage all of that data.
This is where Grafana comes in, and it is the tool I want to talk about because it provides not only a ridiculously wide range of monitoring options but also an incredible range of deployment options with which you can make your Grafana instance managed or customized, meaning that it is a solution for both kinds of people: those who prefer self-made solutions and those who prefer ready-made.
When I first started looking into Grafana, I was writing a blog on how to monitor multiple compute instances over several different clouds using the monitoring services of one cloud, and I found that while that is pretty simple, there are still a few awkward hitches to the solution. Most of the time, choosing one cloud over the other resulted in complications arising in other services on the platform. A lot of these problems were solved by Grafana and all the love and work that has gone into making it.
So, let’s dive into the use of Grafana with its free account tier:
- Firstly, create a Grafana account. It is completely free and has a lot of SSO options, which I appreciate.
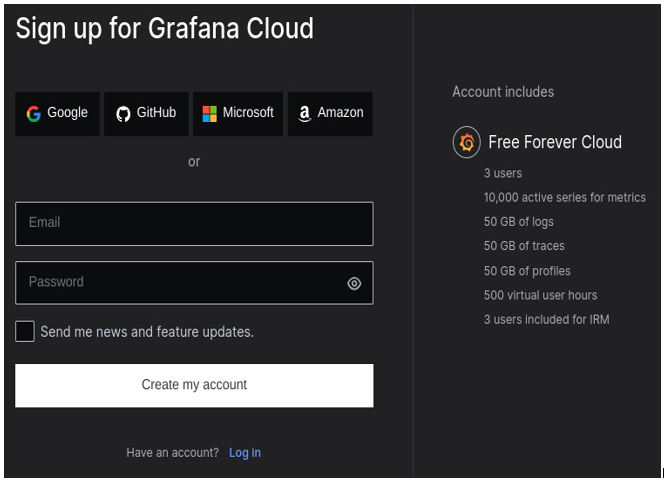
Figure 13.7 – Grafana signup
- It will then ask you for your own personal monitoring subdomain URL and the region for deploying your instance. Once you set those, you are good to go.
- Alternatively, you can download and install Grafana on a custom server from here: https://grafana.com/grafana/download?edition=oss. It has installation instructions for practically every OS that you can think of.
- Let’s take a look at our dashboard:
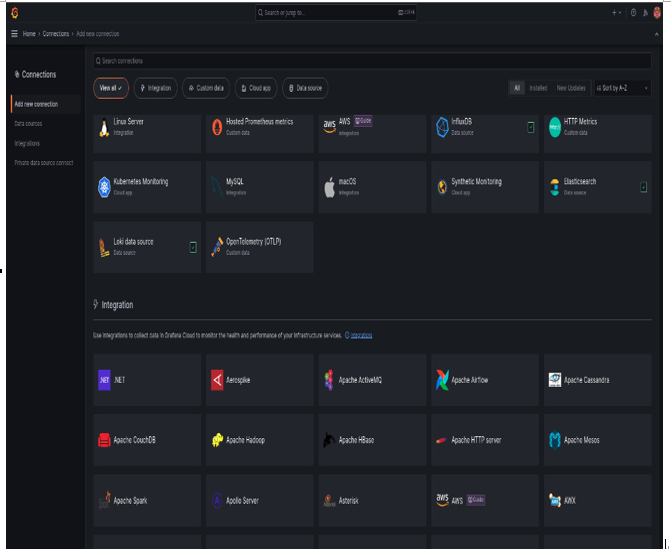
Figure 13.8 – Grafana dashboard
As you can see, Grafana offers us a lot of monitoring options, integrations, and data sources. For this exercise, we will use a data source that is very ubiquitous that just about anyone can access: Google Sheets.
5. In your console’s search tab, search for Google Sheets. You will then have to install the plugin. It is the blue button at the far right:
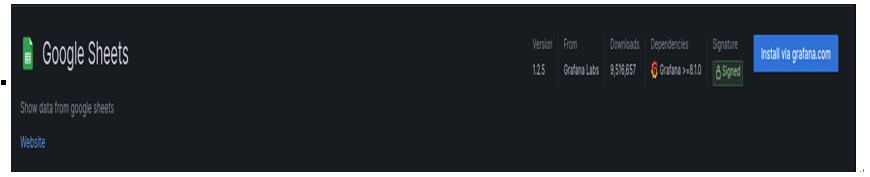
Figure 13.9 – Google Sheets connector
6.Then, wait a minute for the plugin to install, and add a new data source from that same page.
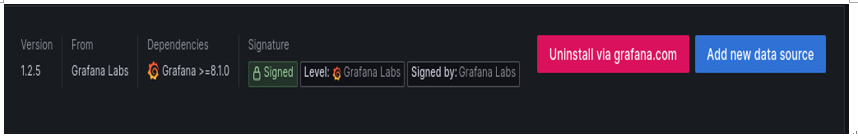
Figure 13.10 – Google Sheets connector activated
7. Grafana will then ask you to create authentication credentials for your Google Sheets instance that you want to access, and it will even give you the proper instructions to do so.
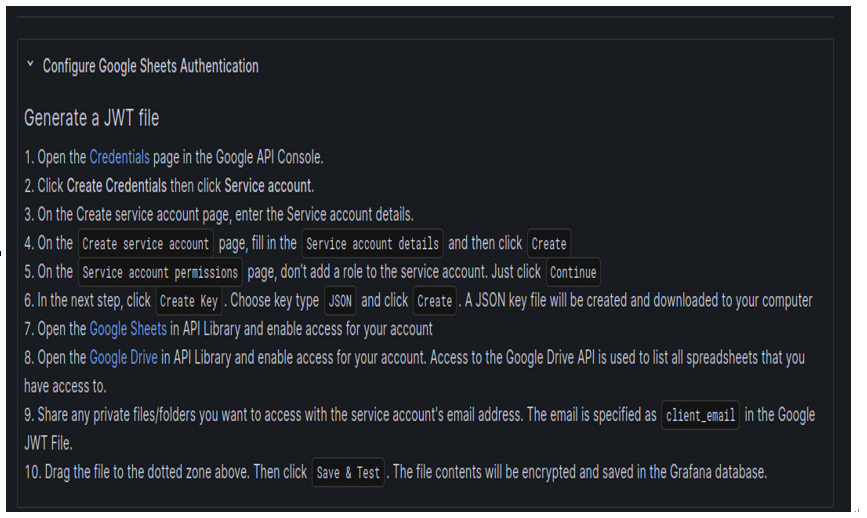
Figure 13.11 – Instructions provided by Grafana on its dashboard
In this case, security-wise, the JWT token option is probably the best. You do not want to keep stray API keys lying around; therefore, please do the following:
- Follow the steps given to create a service account and give that service account’s email address access to your sample Google Sheet.
- Once you have uploaded your JWT key, you will have access to anything that the service account we used has access to. I used a Google Sheet that contained some sample web traffic data, but you can use any sheet that you want for this operation.
The cache time for this dashboard has been set to zero seconds, meaning that it will refresh as the information on the Google Sheet changes.
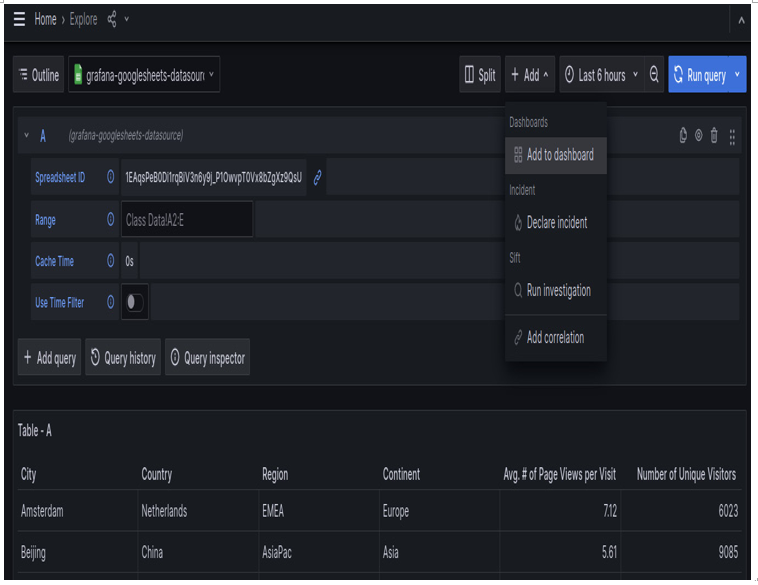
Figure 13.12 – Sample exploration with the option to add to a dashboard
You can then add this exploration to a new monitoring dashboard. As seen in Figure 13.12, you can select the Add button and then the Add to dashboard option.
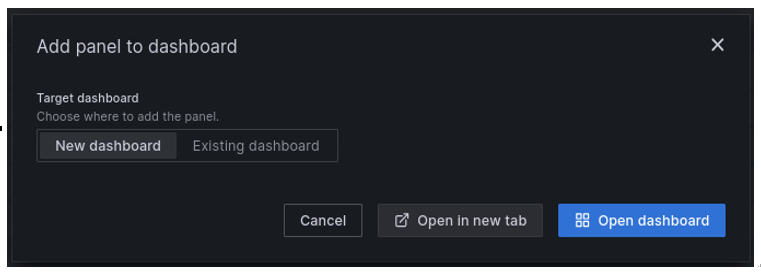
Figure 13.13 – Creating a new dashboard with a panel
8.This will create a new dashboard with your data table. We can now add some visualizations for our data on top of it. In the new dashboard, click on Add and then Visualization. You’ll get a panel similar to the one for the Google Sheets table where you can add a chart like this:
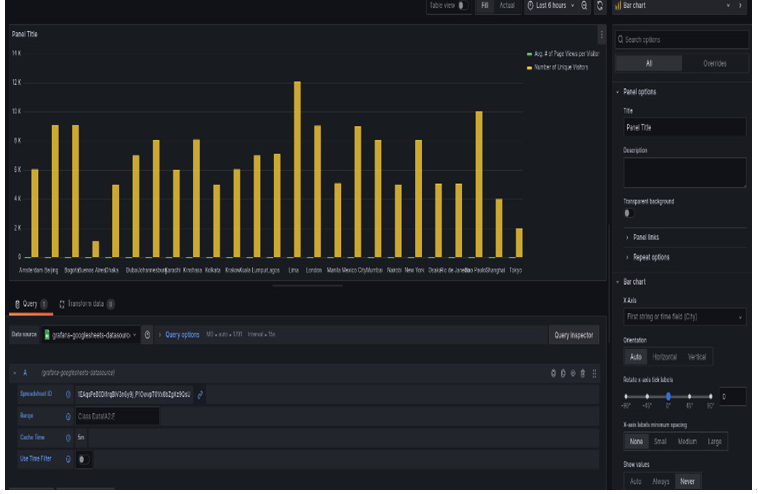
Figure 13.14 – Bar graph produced by visualization
You can see we have a highly customizable chart containing all of the information in a visualized form.
Once you have made your visualization, go back to your newly created dashboard. Your final visualization will look something like this:
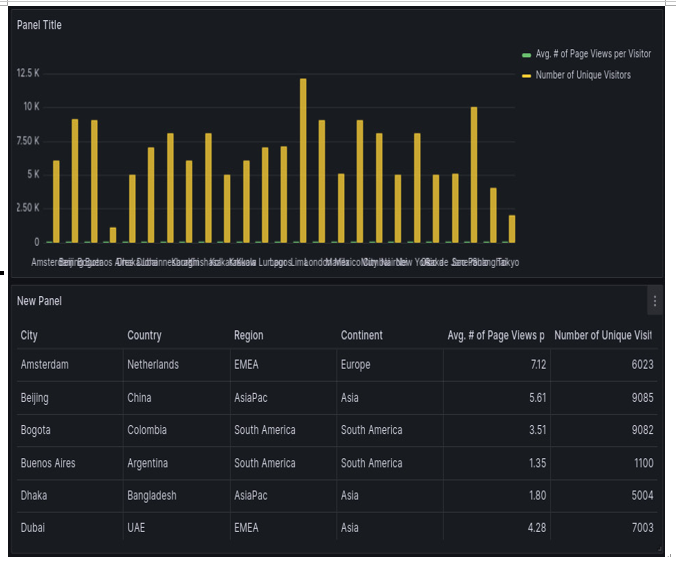
Figure 13.15 – Final Grafana dashboard
Again, this changes according to changes in data.
So far, we have seen events and automations that deal with events. But what happens when an event occurs that you can’t just reset your way out of? What happens when you are on the back foot and are forced to run damage control? Well, we are going to find out in the next section.